Recent Research on Area Deprivation and the P20W Pipeline
Ari Fenn, PhD, Researcher
January 26, 2022
Earlier I introduced research in a previous blog post that was in the pipeline. It is finally ready for release. I want to take the opportunity to present some primary findings. This research quantifies the relationship between area deprivation, measured by the Utah Department of Health's Health Improvement Index (HII), and twelve P20W outcomes. P20W metrics measure the educational pipeline and how it affects the economy; more research can be found here. This research adds to the understanding of how external conditions are related to childhood educational achievement, or put differently, are children's educational outcomes related to factors far beyond their control?
These twelve outcomes were investigated to understand how area deprivation and achievement are related. These outcomes range from early childhood education to post-secondary success, measured during the 2017 and 2018 school years. These years were chosen as they overlapped with 2017, the year for which HII was calculated. The outcomes of interest are:
Outcomes:
- Kindergarten Readiness in language measured by Kindergarten Entry and Exit Profile (KEEP) literacy score.
- Kindergarten Readiness in numeracy measured by KEEP numeracy score.
- Third-grade language proficiency measured by Student Assessment of Growth and Excellence (SAGE) ELA score.
- Third-grade math proficiency measured by SAGE math score.
- Eighth-grade language proficiency measured by SAGE ELA score.
- Eighth-grade math proficiency measured by SAGE math score.
- Eighth-grade science proficiency measured by SAGE science score.
- If a student was chronically absent.
- Whether a high school student enrolled in a college-prep course.
- If a student was "College Ready" on the ACT.
- Whether a student enrolled in a post-secondary institution.
- If a student attending a post-secondary institution majored in STEM.
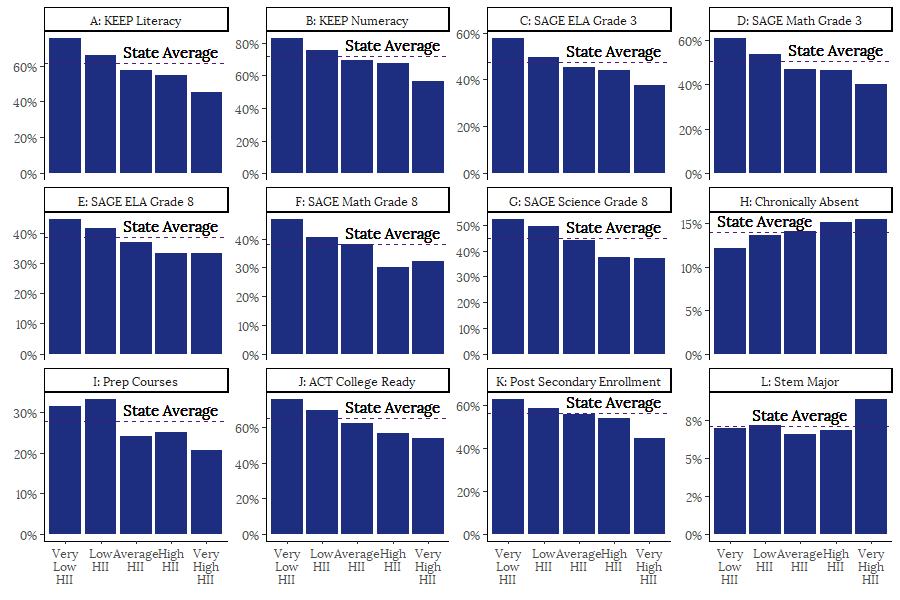
Descriptive Findings
Eleven of the twelve outcomes vary by HII group. For the outcomes where proficiency is the measure, the areas with the lowest levels of deprivation have the highest percentage of proficient students. On the other end, the areas with the highest levels of deprivation consistently have the lowest percentage of proficient students. For chronic absenteeism, the pattern reverses, the most deprived areas have the highest percentage of students who qualify as chronically absent, and the least deprived areas have the least amount of chronically absent students. Additionally, for all outcomes except STEM majors, the least deprived areas consistently perform above the state average while the most deprived areas consistently underperform compared to the state average. These findings are demonstrated in Figure 1.
The overall goal was to isolate a relationship between living in increasingly more "deprived" areas and individual achievement. Isolating the relationship was done with different regressions that controlled for individual characteristics and whether the student's area was urban, rural, or frontier. These results are reported in the forthcoming publication, which will be available on our website.
This research highlights the important relationship between area deprivation and educational outcomes. This finding is an important and often overlooked part of educational achievement, which should be of interest to the general public and policymakers.