Overview
This research uses data from the Utah State Board of Education (USBE) and Utah System of Higher Education (USHE) to examine postsecondary outcomes for low-income students from Utah high school cohorts from 2012 to 2014. Statistical tests were applied to study the relationship between low-income status and various postsecondary outcomes, including enrollment, cumulative GPA, award, drop-out pattern, time to enrollment, time to award, and time to drop out.
Understanding low-income students' postsecondary outcomes may be valuable as education attainment could potentially increase students' productivity and long-term wages. Completing any postsecondary program is associated with higher wages and increased general consumption. This increase in consumption benefits the state from increased economic activity and potential sales tax revenue. While UDRC has investigated the workforce and career metrics of those who experienced intergenerational poverty, the current study focuses on low-income students' education outcomes to develop a deeper understanding of the challenges they face as they pursue postsecondary education.
Summary of Findings:
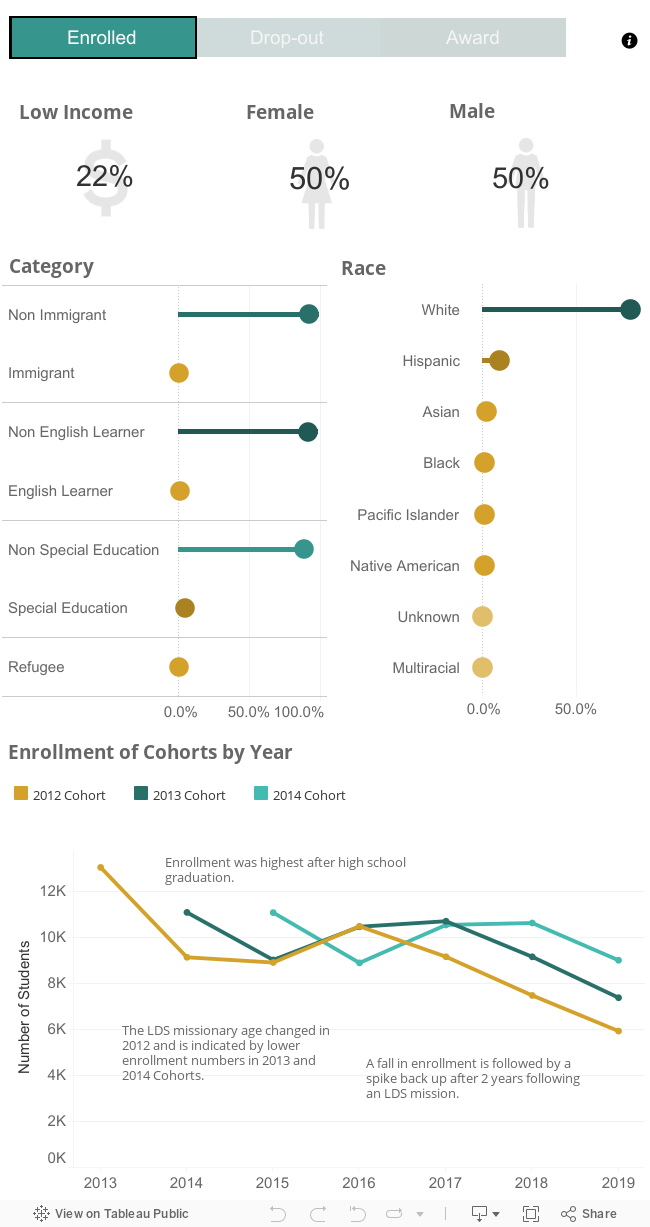
For all low-income students, 38% enrolled in postsecondary education, while 56% of the control group enrolled in postsecondary education.
The length of time to enroll at a degree-granting institution is statistically significantly longer for low-income students than for the control group.
For all students who enrolled at a technical college, it took 2.6 years on average for low-income students to enroll after high school completion, while it took 2.7 years on average for the control group to enroll.
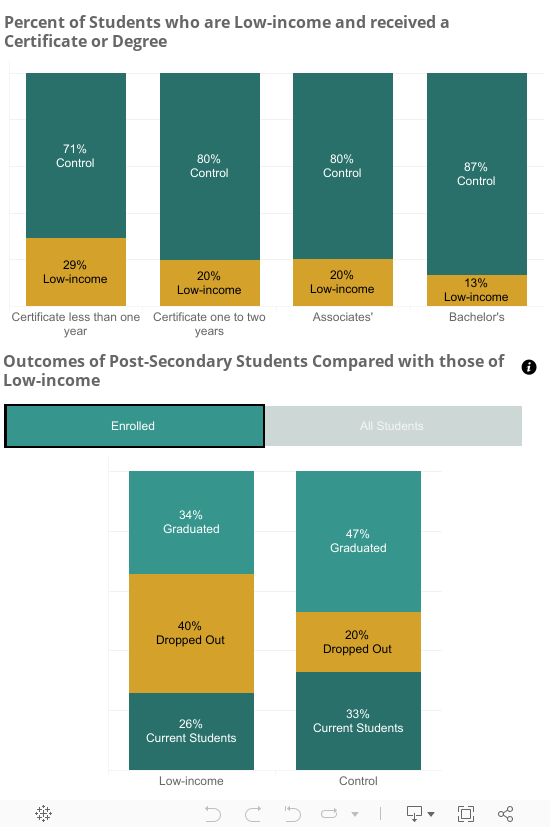
Among all students, the proportion of low-income students who did not enroll in postsecondary education is strikingly larger than the proportion of the control group.