Public Assistance and
Postsecondary Education in Utah

Published January 2023

Overview

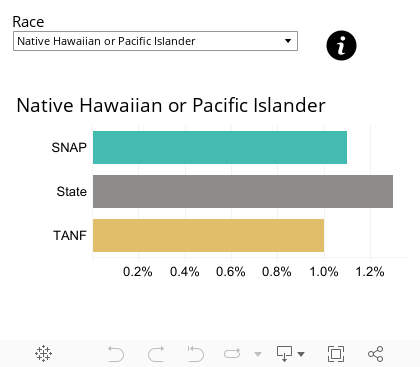
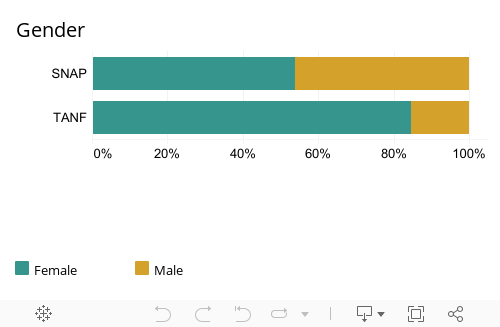
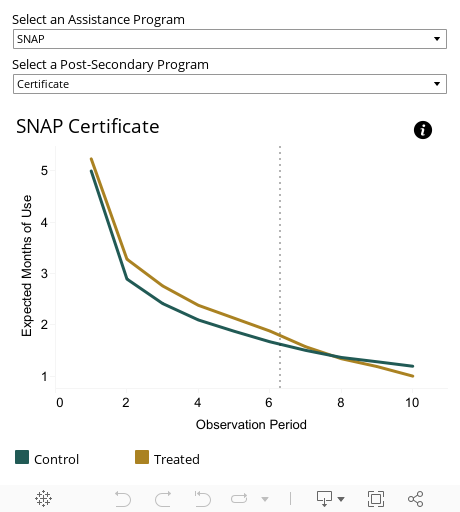
This narrative shows how completion of a technical certificate, associate’s degree, or bachelor’s degree (postsecondary program from here) from a public technical college or degree-granting institution in Utah relates to use of public assistance programs. Public assistance in this research is two common programs Temporary Assistance for Needy Families (TANF), a cash-based assistance program, and Supplemental Nutrition Assistance Program (SNAP) which provides funds for families to supplement their food budget. These programs are designed to help families on their way to “self-sufficiency.” This research uses Utah Department of Workforce Services (DWS) data for SNAP and TANF users along with Utah Data Research Center's (UDRC) education and workforce data.

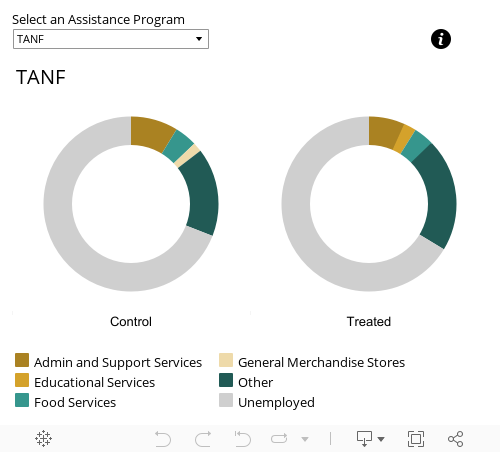
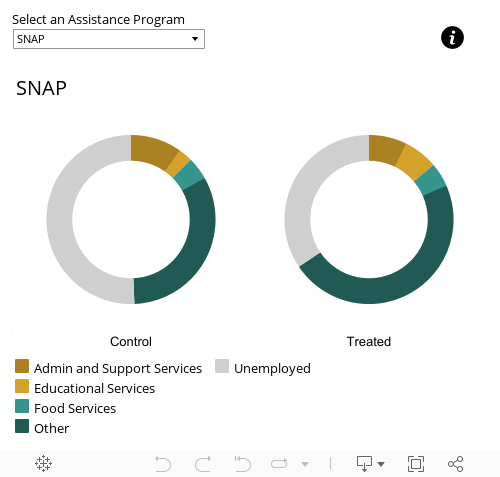
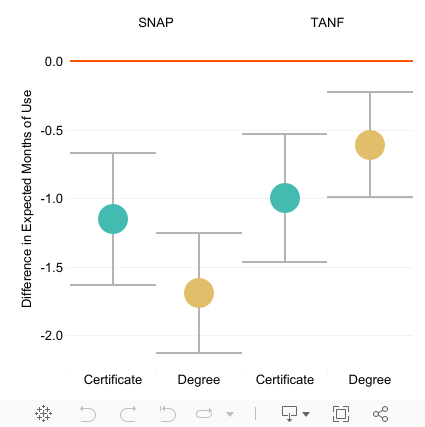
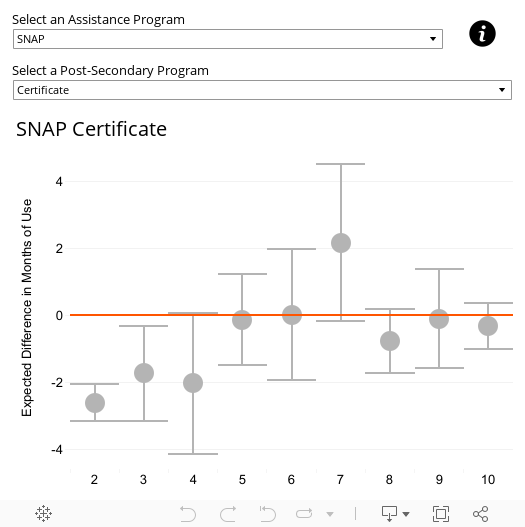
This study quantifies the difference in public assistance use for those who complete a postsecondary program before and after completion. This study looks at the five years after the first month of public assistance use for all SNAP and TANF users in Utah whose first month of use was between January 2009 and December 2019. UDRC previously established a relationship between education and earnings for a subset of this population. This study tests if the relationship between education and income extends to public assistance use. Those who completed a postsecondary program during their five-year observation window are referred to as the treatment group. Those who did not complete a postsecondary program are the control group. The control group is used to help establish overall trends of use.

Summary of Findings

Finding 1: Public assistant recipients are less likely to be white and more likely to be female than the overall Utah population.


Finding 2: Degree and certificate program completers are more likely to be employed and employed in higher wage industries than the control group


Finding 3: Treated and Control groups tend to have similar semi-annual use patterns of public assistance programs.


Finding 4: Those that completed a postsecondary program are expected to use fewer months of assistance than before completion (after controlling for general trends).


View Glossary of Terms

Detailed Findings

Finding 1: Public assistant recipients are less likely to be white and more likely to be female than the overall Utah Population.

White public assistance
users are
underrepresented by
25% (SNAP) to
34% (TANF)
compared to overall
state demographics.

As a percent of
public assistance users,
women make up
9% (SNAP) and 72% (TANF)
more of the population
than overall state demographics.

  • Black Utahns are overrepresented in terms of both SNAP and TANF use. Despite making up 1.5% of Utah’s population, Black Utahns are 2.1% and 4.4% of SNAP and TANF users.
  • American Indians and Alaska Natives are 3.3% of TANF users and 3% of SNAP users. This is 200 and 173 percent more than their percent of the Utah population, 1.1%.
  • Women account for 49.4% of the population of Utah but were 84.5% of TANF recipients and 53.8% of SNAP recipients during the study period. The overrepresentation of women in TANF is likely due to the income cutoffs along with the requirement to be a parent, making single parents more likely to qualify.
  • The over-representation in the data is by groups that face the strongest structural barriers to equal access to well-paid work and steady employment. For women, this can be due to the well-established gender wage gap
Figure 1: This figure compares the racial makeup of each public assistance program to state-level demographics.
*Note: The definitions of some categories for race present in the assistance program data did not match with Census data. For these state-level statistics are left empty.
Figure 2: This figure shows the gender makeup of each public assistance program

Finding 2: Degree and certificate program completers are more likely to be employed and employed in higher-wage industries than the control group

On initial assistance use,
the treated group had
between
10% and 24%
more users employed
than the control group.

After assistance use,
the treated group had
between
23% and 35%
more users employed
than the control group.

  • At the beginning of the initial spell of public assistance use, 53% of those who used SNAP and later completed a postsecondary program were employed compared to 41% of those who did not complete a postsecondary program.
  • The majority of TANF recipients were unemployed at the start of assistance use. Of those who went on to complete a postsecondary program, 66% were unemployed and 69% of those who did not were unemployed.
  • Regardless of completion status, the majority of SNAP users were employed after their final spell of SNAP use. For TANF recipients, of those who did not complete a postsecondary program, the majority were unemployed after their final spell of use, 56%, while the majority of postsecondary program completers were employed.
  • Beyond differences with those who had jobs, there are differences in where those who completed a postsecondary program were employed. Health Care become a major industry of employment for TANF recipients who completed a postsecondary program. This industry tends to have higher average wages than many service jobs.
Figure 3: This graph shows the industries of employment by public assistance program and treatment status during the first month of assistance use.
Figure 4: This graph shows the industries of employment by public assistance program and treatment status after the final spell of assistance use.

About Findings 3 and 4

In findings three and four each period referred to is a standardized six-month observation period. The first observation period is months 1 through 6, the second is 7 through 12, and so on.

Finding 3: Treated and Control groups tend to have similar semi-annual use patterns of public assistance programs.

During the first period,
the treatment group is
expected to use between
4% and 10%
more assistance.

During the final period,
the difference in expected assistance use is between
-0.2 to 0.1
months.

  • All groups show similar patterns of use with the highest average months of use during the first six-month period and a steep drop off in average months of use between the first and second periods.
  • TANF users continue with sharp declines in use with any group expected to use 1 month of TANF during any given six-month period after the second year of observation.
  • SNAP users are expected to use fewer months each observation period than the previous, though by the end of the five years SNAP users are still expected to use more than one month of assistance every observation period.
  • For those who receive SNAP and complete a certificate there is clear divergence in use between treatment and control groups after the average completion period.
  • Those who complete a degree and received TANF have the largest difference in use between the treated and control group before average completion. After the average period of completion, the two groups converge on use, with evidence for the treated group to have lower use long term.
  • Overall between the treated and control groups, there are similar use patterns before the average graduation period. After the average graduation period there is evidence that the treated groups are expected to use less assistance than the control group per observation period.
Figure 5: This figure shows the average number of months of use for each observation period.
*Note: The dashed vertical line represents the average graduation period.

About Finding 4

This section uses a difference-in-differences analysis to find the average treatment effect on the treated (ATT). The results compare the expected number of months of use before and after completion of a postsecondary program for those who complete a postsecondary program, the treated group. The control group helps establish general trends of use for each observation period. The ATT is the weighted average of the cohort-specific treatment effect on the treated. The cohorts that graduated earlier have a higher weight as they appear in more periods post-graduation. The cohort that graduated during the first observation period is not included as there is no pre-graduation use available for this cohort. A cohort refers to those who completed a postsecondary program during the same standard observation period, it does not refer to calendar month and year.

Finding 4: Those that completed a postsecondary program are expected to use fewer months of assistance than before completion (after controlling for general trends).

SNAP recipients who
graduate
use between
1.2 and 1.6
fewer months of SNAP
for each six-month
observation period.

TANF recipients who
graduate
use between
0.6 and 1
fewer months of TANF
for each six-month
observation period.

  • Controlling for general use trends, after graduation from a postsecondary program graduates are expected to use less public assistance than before graduation. The effect is larger for SNAP recipients than for TANF recipients. Part of this is due to benefit limits of TANF ensuring lower use in general.
  • SNAP users who completed a degree program in the first six months are expected to use 2.5 fewer months of SNAP during each subsequent six-month observation period.
  • TANF users who earn a certificate in the first three observation periods are expected to use between 0.8 and 2 fewer months of TANF during each subsequent observation period.
  • There is evidence that the effects of graduation are stronger the earlier an individual graduates.
Figure 6: This graph shows the average treatment effect on the treated. It shows the difference in months of assistance a graduate is expected to use after graduation after controlling for overall use trends (Figure 5). The red line at zero represents no difference.
Figure 7: This graph shows the cohort-specific treatment effect on the treated. It shows the difference in months of assistance a graduate is expected to use after completion based on the observation period in which the graduate graduated. The red line at zero represents no difference.

Limitations

  • Due to limitations in data availability this study used a five-year observation window. The average completion period was more than halfway through the five-year window, making it impossible to estimate longer-term treatment effects.
  • The method used to estimate the relationship between completion and use is suited for quasi-experimental designs, where people do not self-select into treatment which occurs in this research. Due to this it is not possible to fully attribute the changes in use to effects of education or those who choose to complete education. This may be epirically important when discussing cohort effects.

Conclusion

Full Report

Learn more about SNAP and TANF recipients who earn postsecondary awards

This report provides a deeper look at who used public assistance in Utah and of those who went on to complete a postsecondary program. The report offers intuition into how employment dynamics changed during public assistance use.

Report cover

Glossary

Project
Team

Ari Fenn
Ari Fenn, PhD

Researcher
(Analysis/
Report Author)